Why Nodlin?
Nodlin provides a connected operational layer that can span every aspect of managing your business — from objectives and budgets to tasks, incidents and reports.
This article explains the problem in detail, and how Nodlin’s architecture resolves it.
The current reality
Every business application is designed around a data model — the entities it manages (projects, tasks, budgets, requirements, etc.) — and the logic that keeps those entities consistent. Update a task estimate and the project total rolls up automatically. This works well inside a single application.
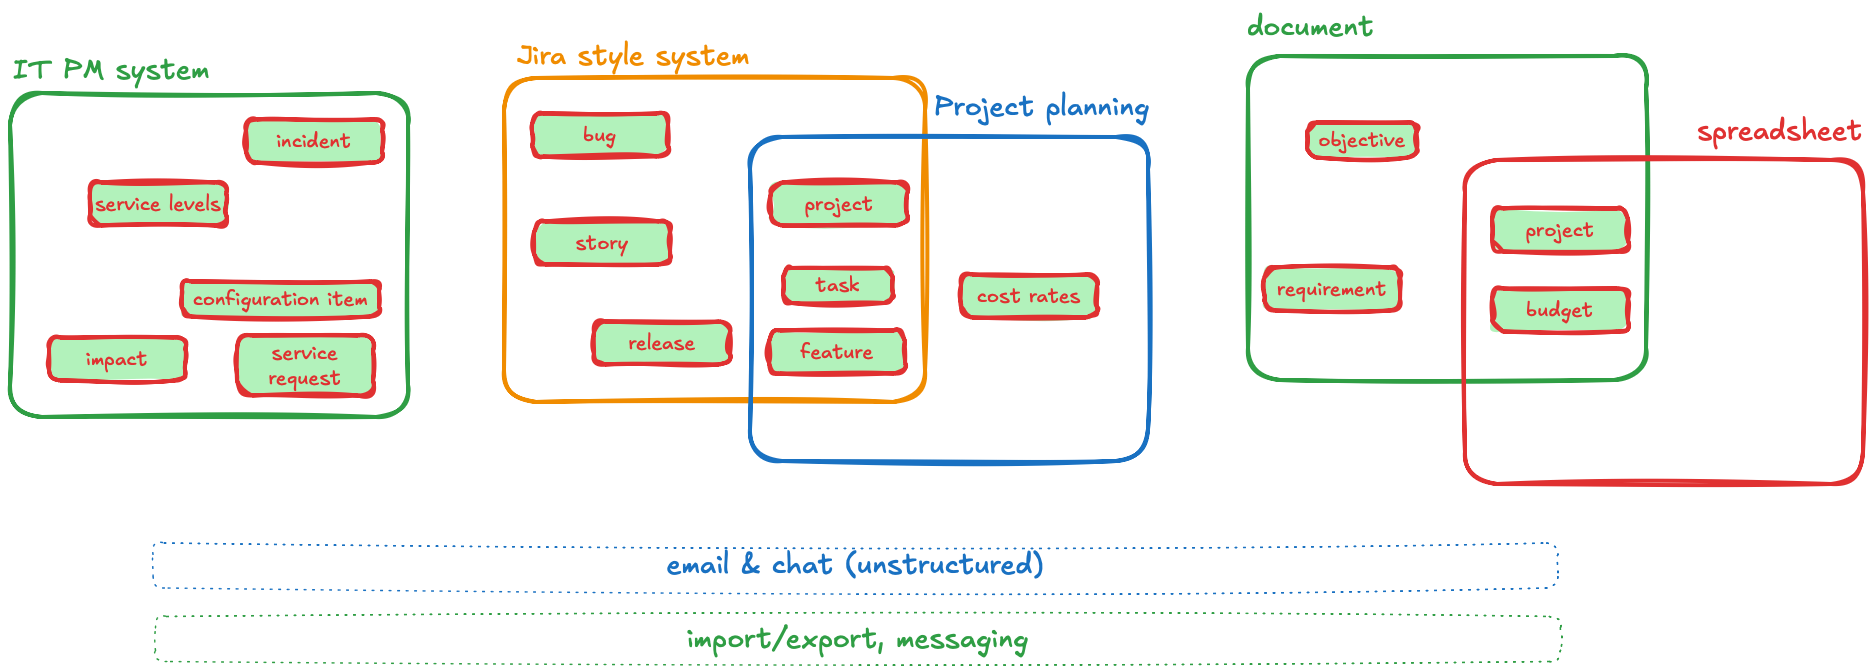
The diagram above shows entities that are typical in an IT organisation, spread across different applications.
Applications tend to grow over time, adding features to bring in more entities and maintain wider consistency. Systems inevitably overlap — they either record the same detail directly, or one entity is a translation of an entity in another system.
There is always a boundary to an application. To bridge these boundaries, organisations build import/export capabilities or connect systems with technology. Where this is done, inconsistencies arise, latency creeps in, and questions about the source of truth multiply.
Where systems are not connected, people fill the gap — transcribing detail via email, chat, attachments and spreadsheets, all of which undermine data consistency across the organisation.
Significant investment goes into integration tooling and collaboration platforms (Microsoft Loop, Notion, etc.), but these all have their own limitations and boundaries, and often result in yet more overlapping capabilities.
The costs and risks compound:
- Information is translated and summarised between applications — human cost in translation, inconsistency, errors, a lag in updates, and decisions based on incomplete or bad data
- Applications keep adding features to maintain wider consistency — overlapping capabilities between tools, confusion about the source of truth
- Unstructured tools fill the gaps (email, chat, Word, spreadsheets) — information overload, duplication, difficulty seeing the big picture, data inconsistencies
To be clear: applications are great at maintaining consistency efficiently. Where you have high volumes of data — millions of transactions — application efficiency and consistency is essential.
But in many cases where users are directly involved, eventual consistency is acceptable. The data doesn’t need to be instantly in sync — it just needs to converge reliably.
Example: technology spend reporting
All IT projects in a large organisation roll up to a single technology budget. A project consists of a hierarchy of tasks (a work-breakdown-structure). Time recorded at the bottom flows up through team costs, group costs, division costs, and ultimately to the firm-wide technology budget.
In practice, these numbers take time to flow. Weekly status reports are summarised monthly, then quarterly, then annually. The cost of executing these steps is high, accuracy is difficult to gauge, and there is a huge time lag on visibility.
This is a case where we already accept eventual consistency — we just manage it manually.
Organisations are a network of systems and people. To manage the human communication flows, businesses establish Standard Operating Procedures and document workflows to ensure people follow defined practice. SOPs are essentially computer code written for humans — they fill the automation gaps. But they introduce their own problems: audit overhead, compliance challenges, and delays.
What we need
We need a model where:
- High-volume transactional data continues to be handled efficiently and consistently (established software engineering)
- Lower-volume, user-driven interactions are handled in a more structured, auditable and efficient manner
The first is well served by existing technology. The second is where the gap lies.
For user-driven data, we need an approach where:
- Information requirements can be easily defined — without heavyweight development
- Information can be related across systems — to maintain consistency
- Behaviour can be defined — so that logic runs automatically when related data changes
In short: something like a spreadsheet, but operating at a multi-user organisational scale, working with structured data rather than numbers.
If we can accept eventual consistency for this class of data, the rigid application boundary is no longer a constraint.
How Nodlin resolves this
Nodlin models the organisation as one large network graph. The nodes in the graph represent data elements, and these nodes can change in relation to each other.
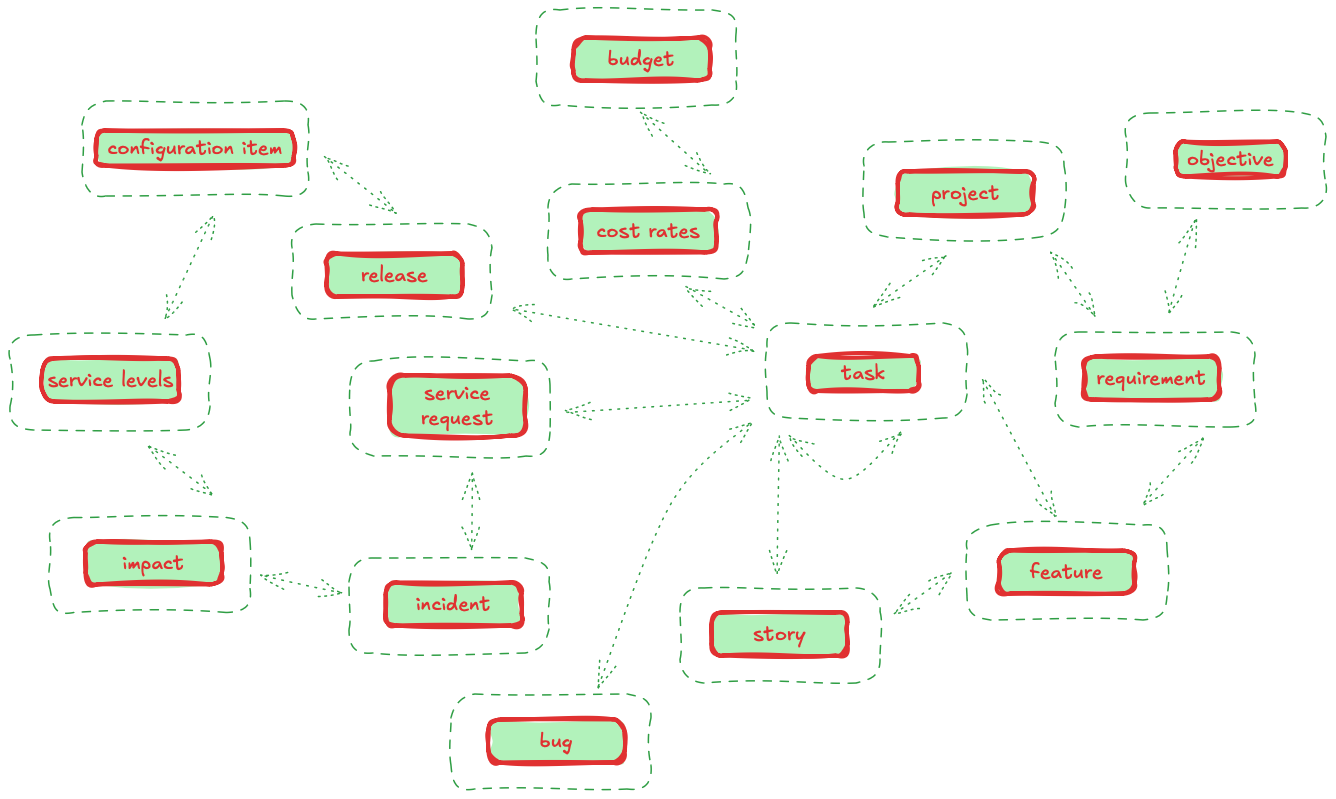
The diagram shows data elements typical in an IT organisation — objectives, requirements, projects, tasks, budgets, incidents, bug reports — represented as nodes with dependent relationships (edges).
In this model, the traditional application that manages a set of entities (e.g. Jira handling projects, tasks and stories) no longer exists as a boundary.
Instead, the logic for handling a task, project, or objective is defined with the data element itself. This logic can reference details in related nodes. For example, a “task” node can review its related sub-tasks to check completion, sum assigned effort, and so forth.
When a node is updated, Nodlin ensures that related nodes are also updated. This progresses until all updates have been completed — the graph eventually becomes consistent.
Nodlin addresses each of the three requirements:
1. Information requirements can be easily defined
Node types can be defined in simple Python-like scripts or provided by external programs using the Nodlin API. User input forms are data-driven (JSON), describing the fields required.
2. Information can be related to maintain consistency
Users can add nodes to the graph, or nodes can add related nodes automatically. Nodlin propagates changes to related nodes and controls update processing until the graph is consistent.
3. Behaviour can be defined to maintain consistency
Nodlin uses the concept of a node Type where behaviour is defined. A Task Type, for example, defines the logic for handling task data — what relationships it supports, what actions can be performed, and what events it responds to. Behaviour can be scripted in a Python-like language or implemented in external programs.
Multiple perspectives on one graph
Viewing an entire organisation as a single graph is not practical. A Nodlin (the term derives from “Nodes and Lines”) provides a particular perspective onto the graph — a scoped view of relevant nodes.
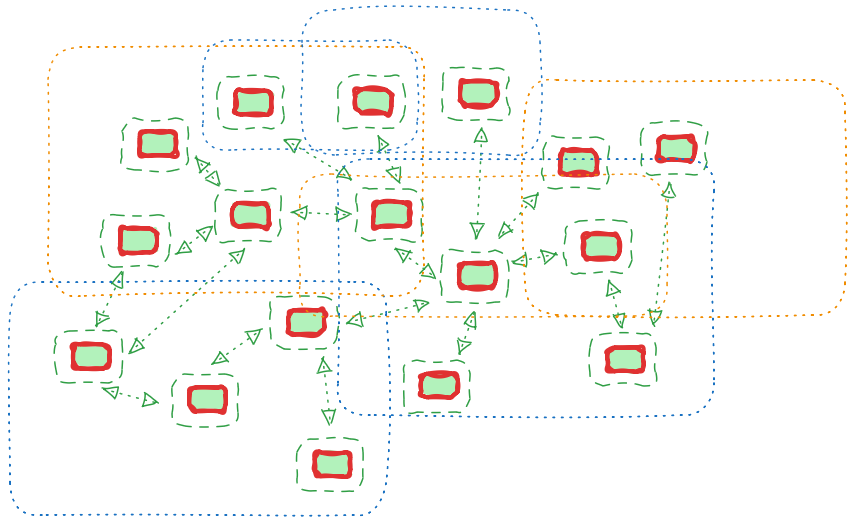
A Nodlin is a container of references to nodes. A node may be referenced in many different Nodlins. A manager might view project nodes across the organisation, while a developer looks at a single project and its related tasks.
Beyond the graph view, Nodlin can present the same data as a board (Kanban), an infographic, a Gantt chart, a document, or a freeform canvas.
Where Nodlin adds value
Nodlin is a general framework for displaying information in context and keeping it up to date in real time. Individuals can focus on particular data points and view them from their own perspective.
Graph-based views can be a more natural way of presenting information in context. Mind maps are a well-established technique for organising thinking — Nodlin’s graph view extends this principle to live operational data.
Example: incident management
During a major outage, multiple groups become involved — investigating causes, assessing impacts, coordinating resolution, and reporting status. In practice, teams create separate chat streams to coordinate, and assessing “where we are” becomes a long exercise of trawling through them all.
With Nodlin, this analysis can be structured — with typed nodes for events, possible causes, investigations, and impacts — all linked and presented in an overall map of resolution.
Nodlin can be applied across a wide range of operational challenges:
- Standardising workflows — Define node types that constitute a workflow (task order, decision points, approvals). Automate your SOPs with auditable, transparent steps.
- Reducing email and chat overload — Replace informal catch-all communication with structured node types that capture detail in a standardised, searchable way.
- Cutting information overload — A single structured source with assigned actions and FYIs focuses attention on what matters, replacing the stream-of-consciousness in chat.
- Integrating AI into workflows — Nodlin supports external agents (including AI services) that can be integrated into workflows as first-class participants.
- Reducing portal sprawl — Instead of building bespoke web portals for every function, define new capabilities as node types — giving users a single tool.
- Structured document authoring — A document is a graph constrained to a tree. Nodlin’s book view supports structured authoring that is easier to work with than a flat page.
- Organisational knowledge management — Connect external systems to Nodlin and let users investigate and link detail across the business from a single interface.
- Replacing static reports — Information in PowerPoint and Visio becomes stale immediately. Nodlin presents the latest available detail, always up to date.
- Faster response than heavyweight tools — Systems like Jira handle data transactionally, which can feel slow at scale. Nodlin nodes are lightweight and processed in real time; broader consistency follows shortly after.
How updates propagate
The logic for each data element is encoded on the node itself. When data changes in a node, the logic is applied to related nodes. Updates flow through the graph until all data elements are consistent.
Because we accept eventual consistency, we are no longer bound by the application constraint that demands immediate consistency. Instead, we have a model where different pieces of information can be related across any boundary — and Nodlin ensures they converge.
