Evidence Graph
Sep 7, 2025
·
2 min read
 Image credit: [Unsplash]
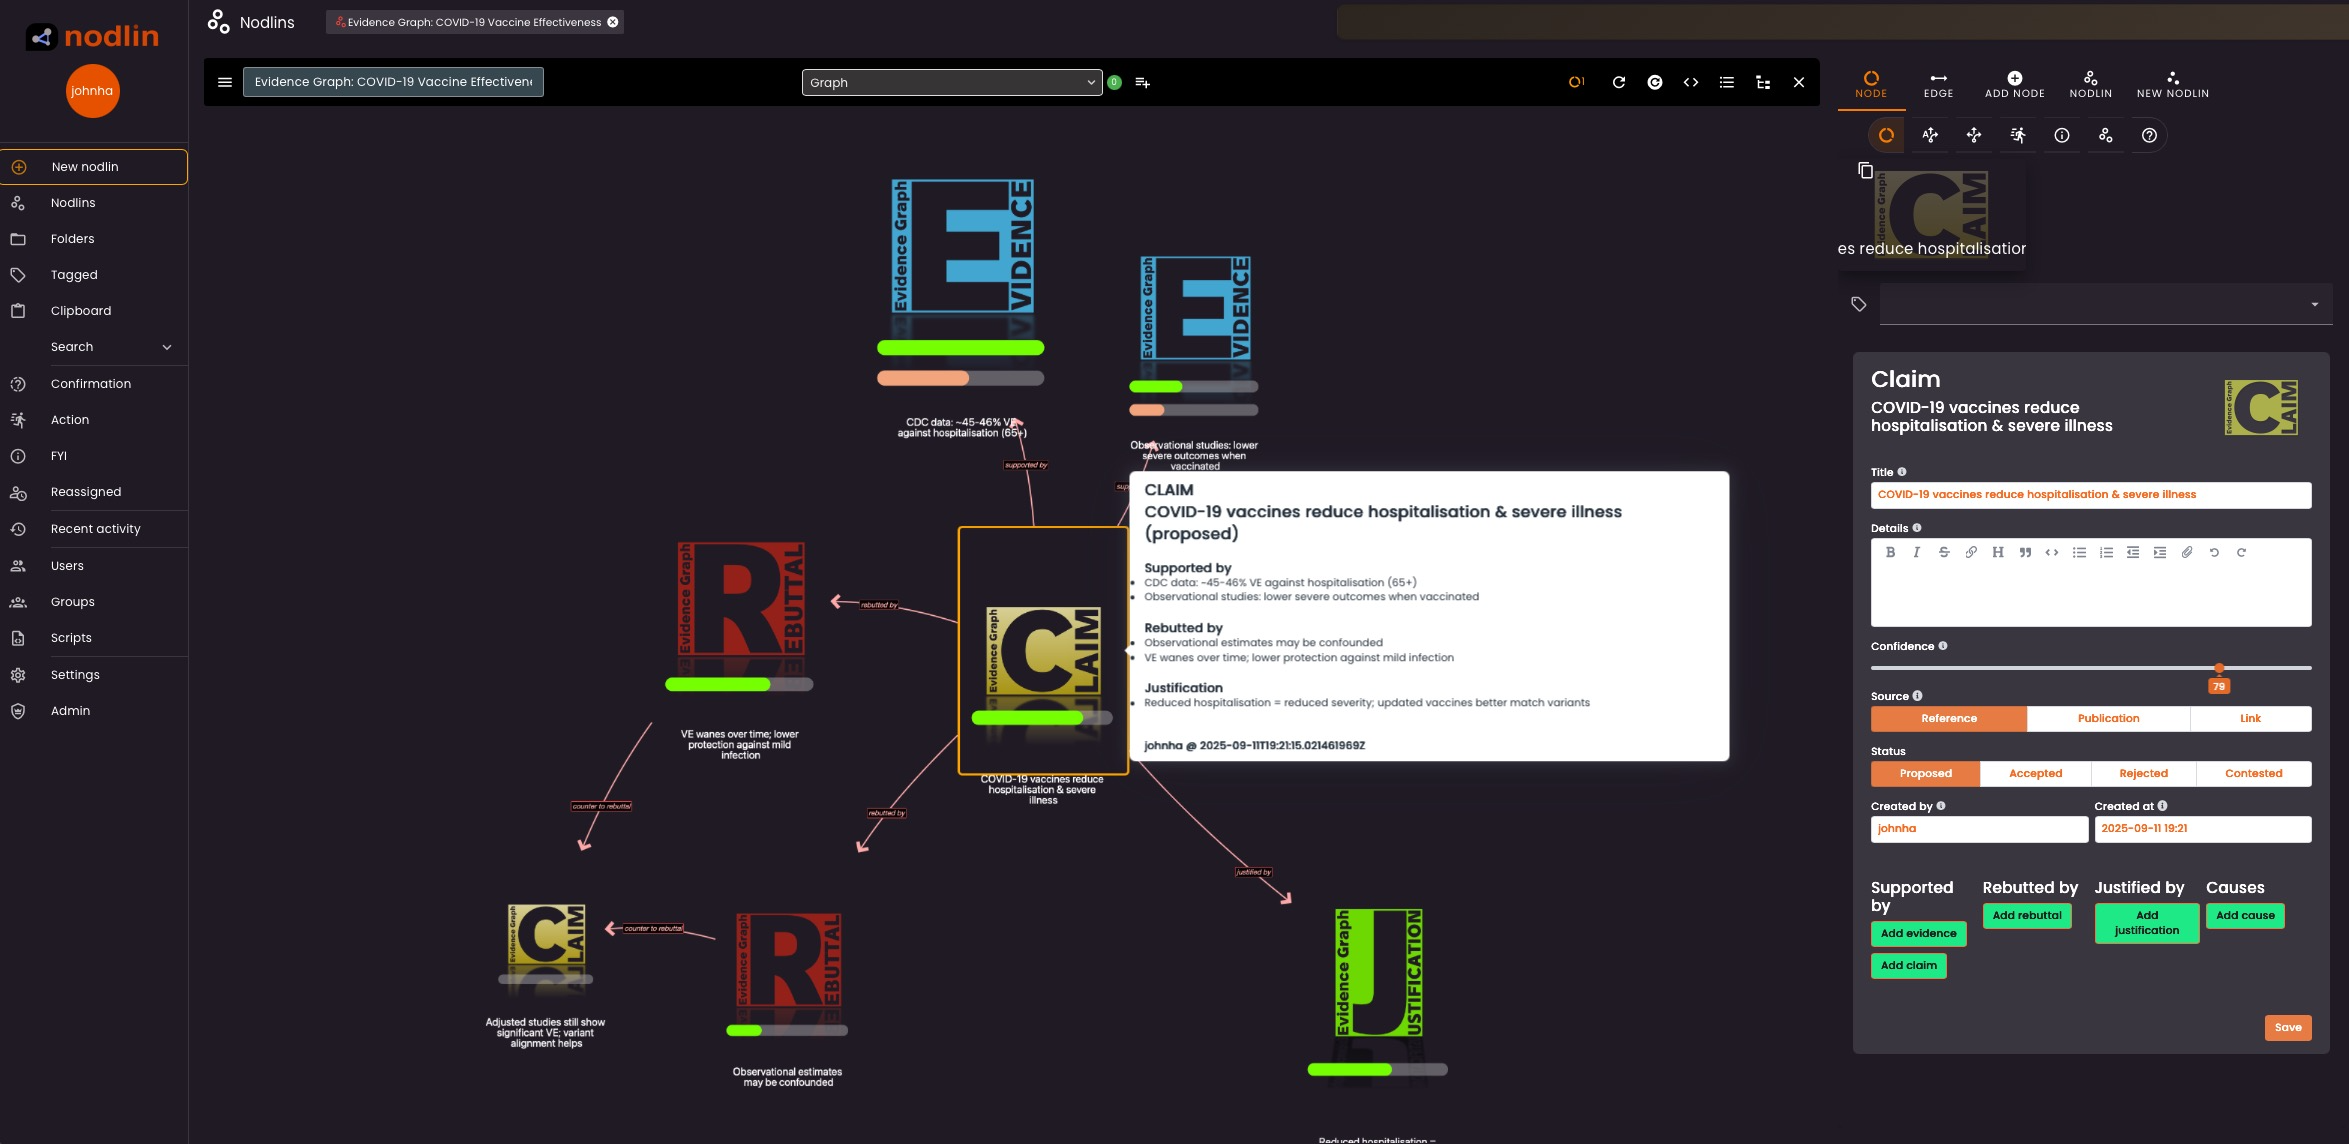
An evidence graph is a structured representation of reasoning around a claim:
- An evidence graph is a directed graph where nodes represent claims, evidence, justifications, rebuttals, or counter-arguments, and edges represent the relationships between them (e.g., “supports,” “rebuts,” “justifies”).
- The purpose is to make explicit how a central claim is supported or challenged, showing chains of reasoning and the strength or weakness of arguments.
Where evidence graphs are used
- Scientific Research & Academia 🧪📚
- To map how studies, datasets, and methods link together.
- Helps researchers trace the origins and reliability of findings.
- Healthcare & Clinical Trials 🏥💉
- Used to link clinical trial results, patient outcomes, and supporting literature.
- Ensures medical guidelines are based on transparent chains of evidence.
- Policy & Decision-Making 🏛️⚖️
- Governments and NGOs use them to justify policies with traceable, data-backed reasoning.
- Supports accountability and transparency in public decisions.
- Data Science & AI 🤖📊
- Provides provenance (where data comes from) and helps explain AI/ML model decisions.
- Makes automated systems more trustworthy.
- Legal & Compliance 📜🔍
- Helps build chains of verified evidence in court cases or audits.
- Ensures that claims are backed with documented proof.
Benefits of evidence graphs
- Transparency 🔎
- Every claim or conclusion can be traced back to its supporting evidence.
- Trust & Credibility 🤝
- Decision-makers, researchers, and the public gain confidence in results.
- Reproducibility 🔄
- By showing how evidence was collected and connected, others can replicate findings.
- Efficiency ⚡
- Saves time by clearly mapping relationships instead of sifting through raw data.
- Integration of Multiple Sources 🌐
- Allows combining diverse data (papers, datasets, expert input) into a single structured view.