Finance solution
 Financial projection for a startup
Nodlin offers a complete solution for mapping out your startup’s finances. It shows how Nodlin can manage the many interconnected aspects of financial planning — from user growth projections to revenue and expense forecasting.
Startup finance involves a mix of assumptions. Some are broad, like overall growth, while others are more concrete — expected revenue from sales, or the level of support required for your projected user base. Even detailed factors such as compute costs (e.g. how many servers are needed to support those users) can be modelled.
With Nodlin, each of these aspects can be captured as separate nodes, then combined to create a comprehensive picture of your finances — covering revenue, expenses, and P&L.
The Finance script agent
The scripts in the finance agent are comprehensive and represent a wide variety of capabilities of the python-like scripting capabilities.
You can modify and create your own versions of these scripts to specialise for your own use-case.
- Finance script package contains a number of node types:
- Date Summary (dateAdjVector)
- A simple vector of dates and values (called adjustments)
- An aggregate of these values can be derived into a summary vector (daily, weekly, monthly, quarterly) for further analysis or charting.
- Operation
- Allow for a simple operation (multiply, divide etc) to be performed on a Date Summary and derives a new vector.
- Non-recurring item (nonRecurringItem)
- Creates a single adjustment for a given date.
- The input form allows for the classification of the one of revenue/expense.
- Recurring item (recurringItem)
- Creates an adjustment for a given date range at a specified frequency (daily, weekly, monthly).
- The input form allows for the classification of the recurring revenue/expense.
- Role (role)
- This could have been represented as a recurring cost. However, in the example we wanted to also track headcount, so we created a specialised node type for this.
- We create 2 lists of adjustments that can be interpreted by the Date Summary. Once for the cost of the role, and one for the headcount.
- Chart (chart)
- A special chart that can represent multiple Date Summary nodes as different series on a single chart.
- Nodlin includes the popular open source chartJS server. Many different styles of chart can be produced from a JSON request. The script provides an example of calling the service.
- S-Curve (sCurve)
- A node script that produces an S-Curve logistic growth projection between 2 values for a series of months.
- This is useful in forecasting a user population (slow initial growth, then a rapid exponential growth with a tail).
- Many assumptions have to be made in assessing a software startup, but this allows for a more systematic approach to forecasting costs.
- Data range (dataRange)
- A simple node type that allows for the input of a date range.
- If you have multiple Date Summary nodes in your model, and you want consistency for the period in which you are performing analysis, then you can define this period once and connect to all the Date Summary nodes.
- Date Summary (dateAdjVector)
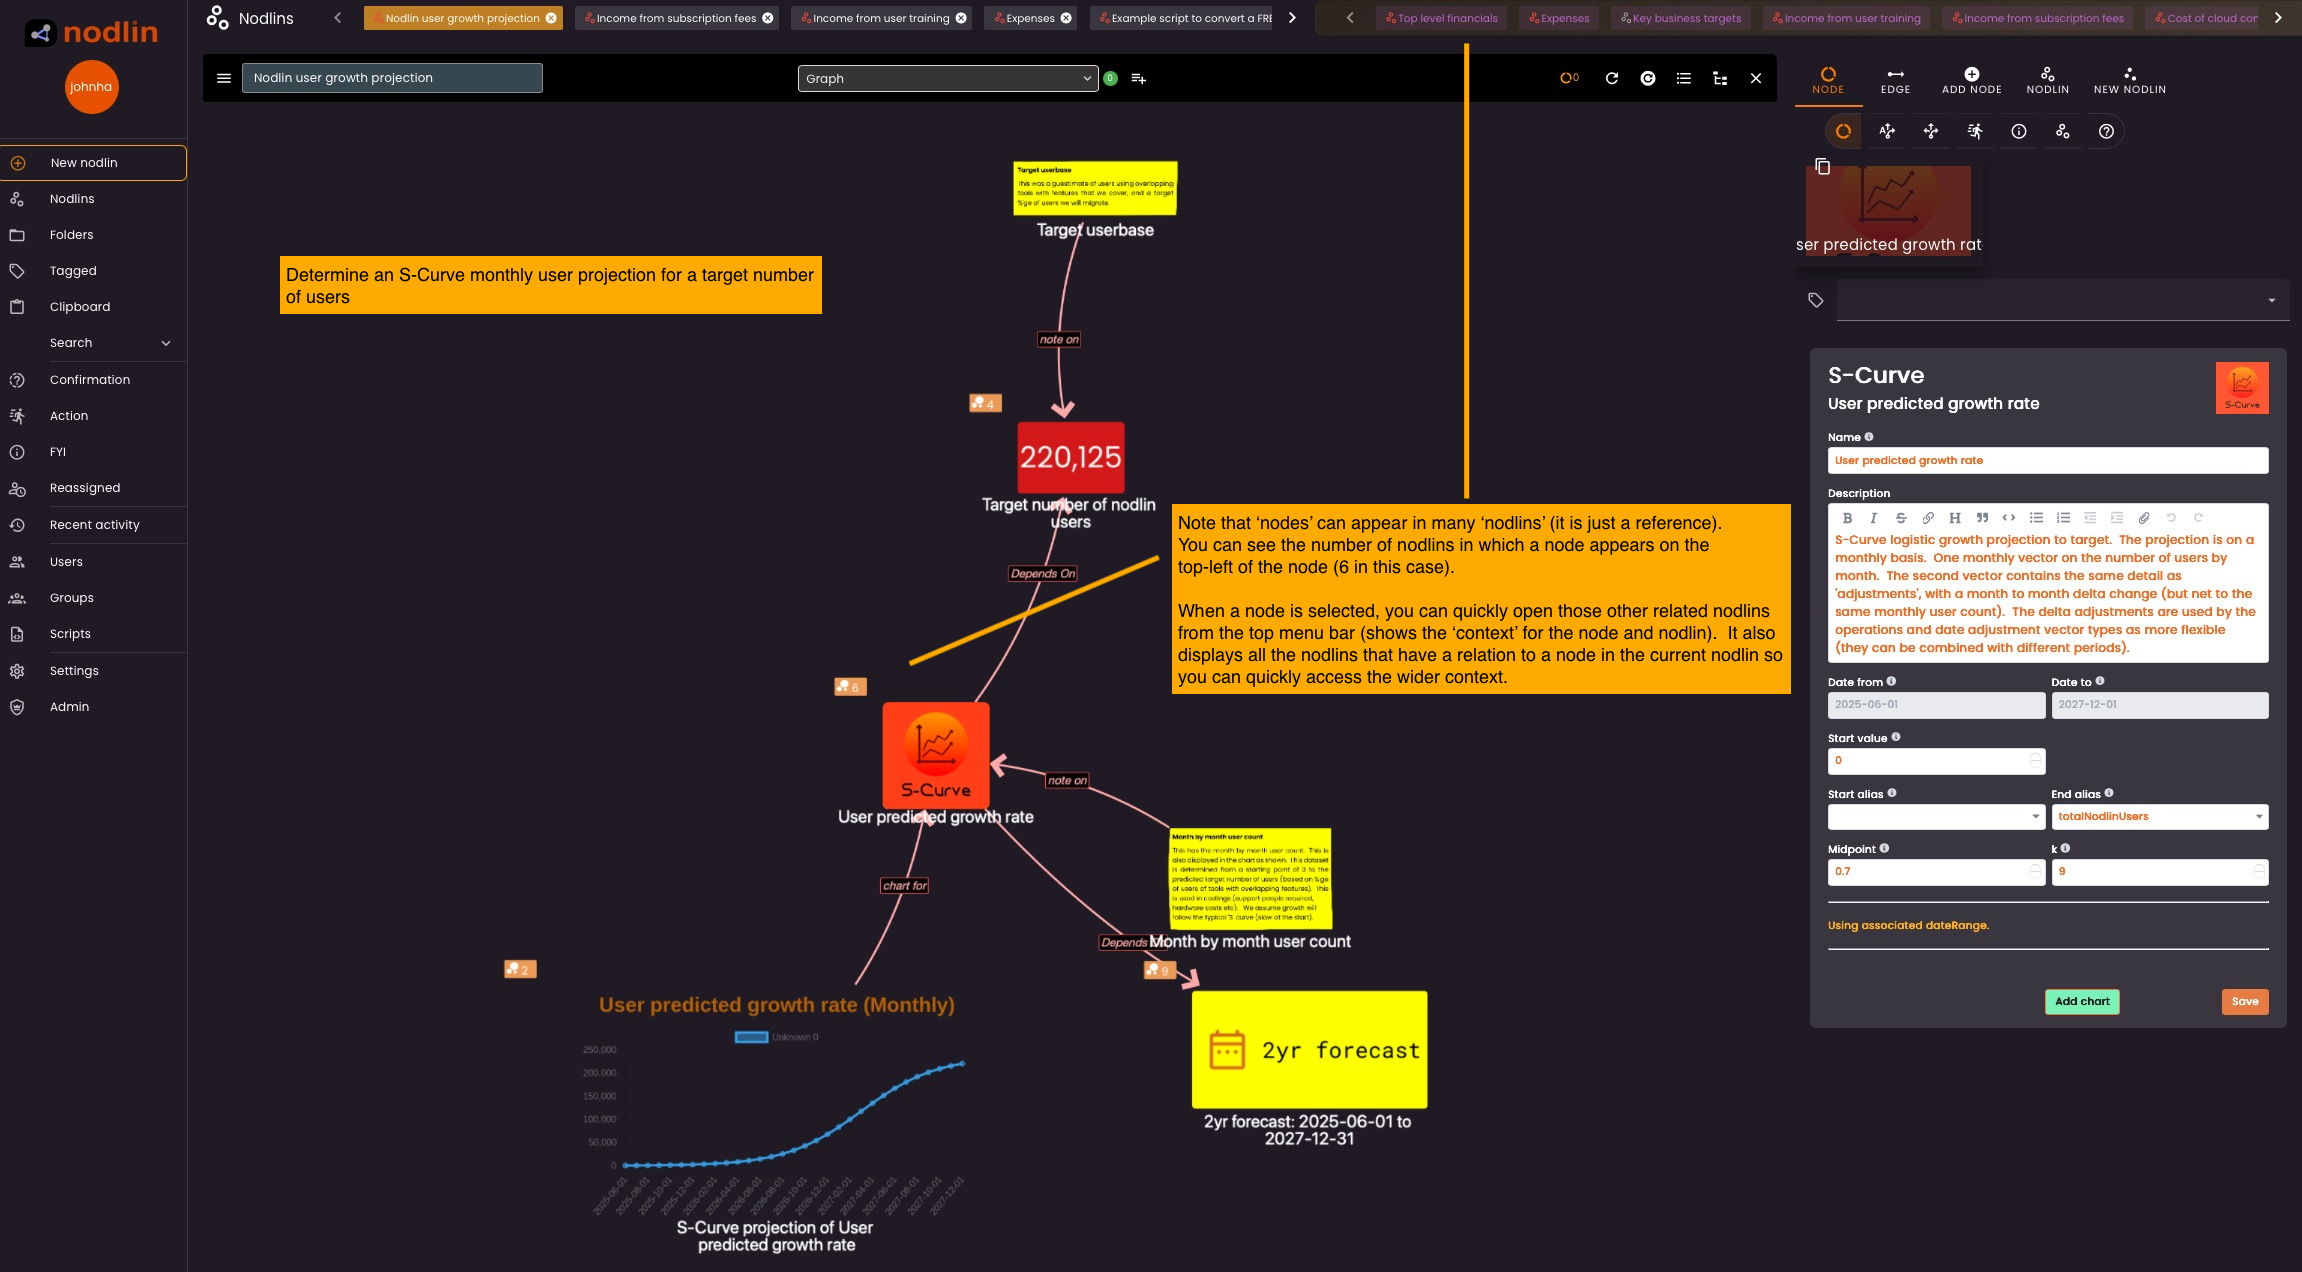
Define user population
Key to costing for a startup is the expected user population.
Various assumptions will have to be made to determine the growth rate of the user base. This user growth (in this example) is presented by an S-Curve (slow to start, exponential growth with a tail).
An understanding of this month-by-month growth is important for forecasting income, costs of compute, staff requirements for support etc.
Assumptions will still have to be made, but you can drill down to the specifics and qualify your assumptions.
In the following example you can see how the S-Curve has been configured. The target user population is based on the market analysis (derived from another script) and an expected conversion of users using those tools who may convert.
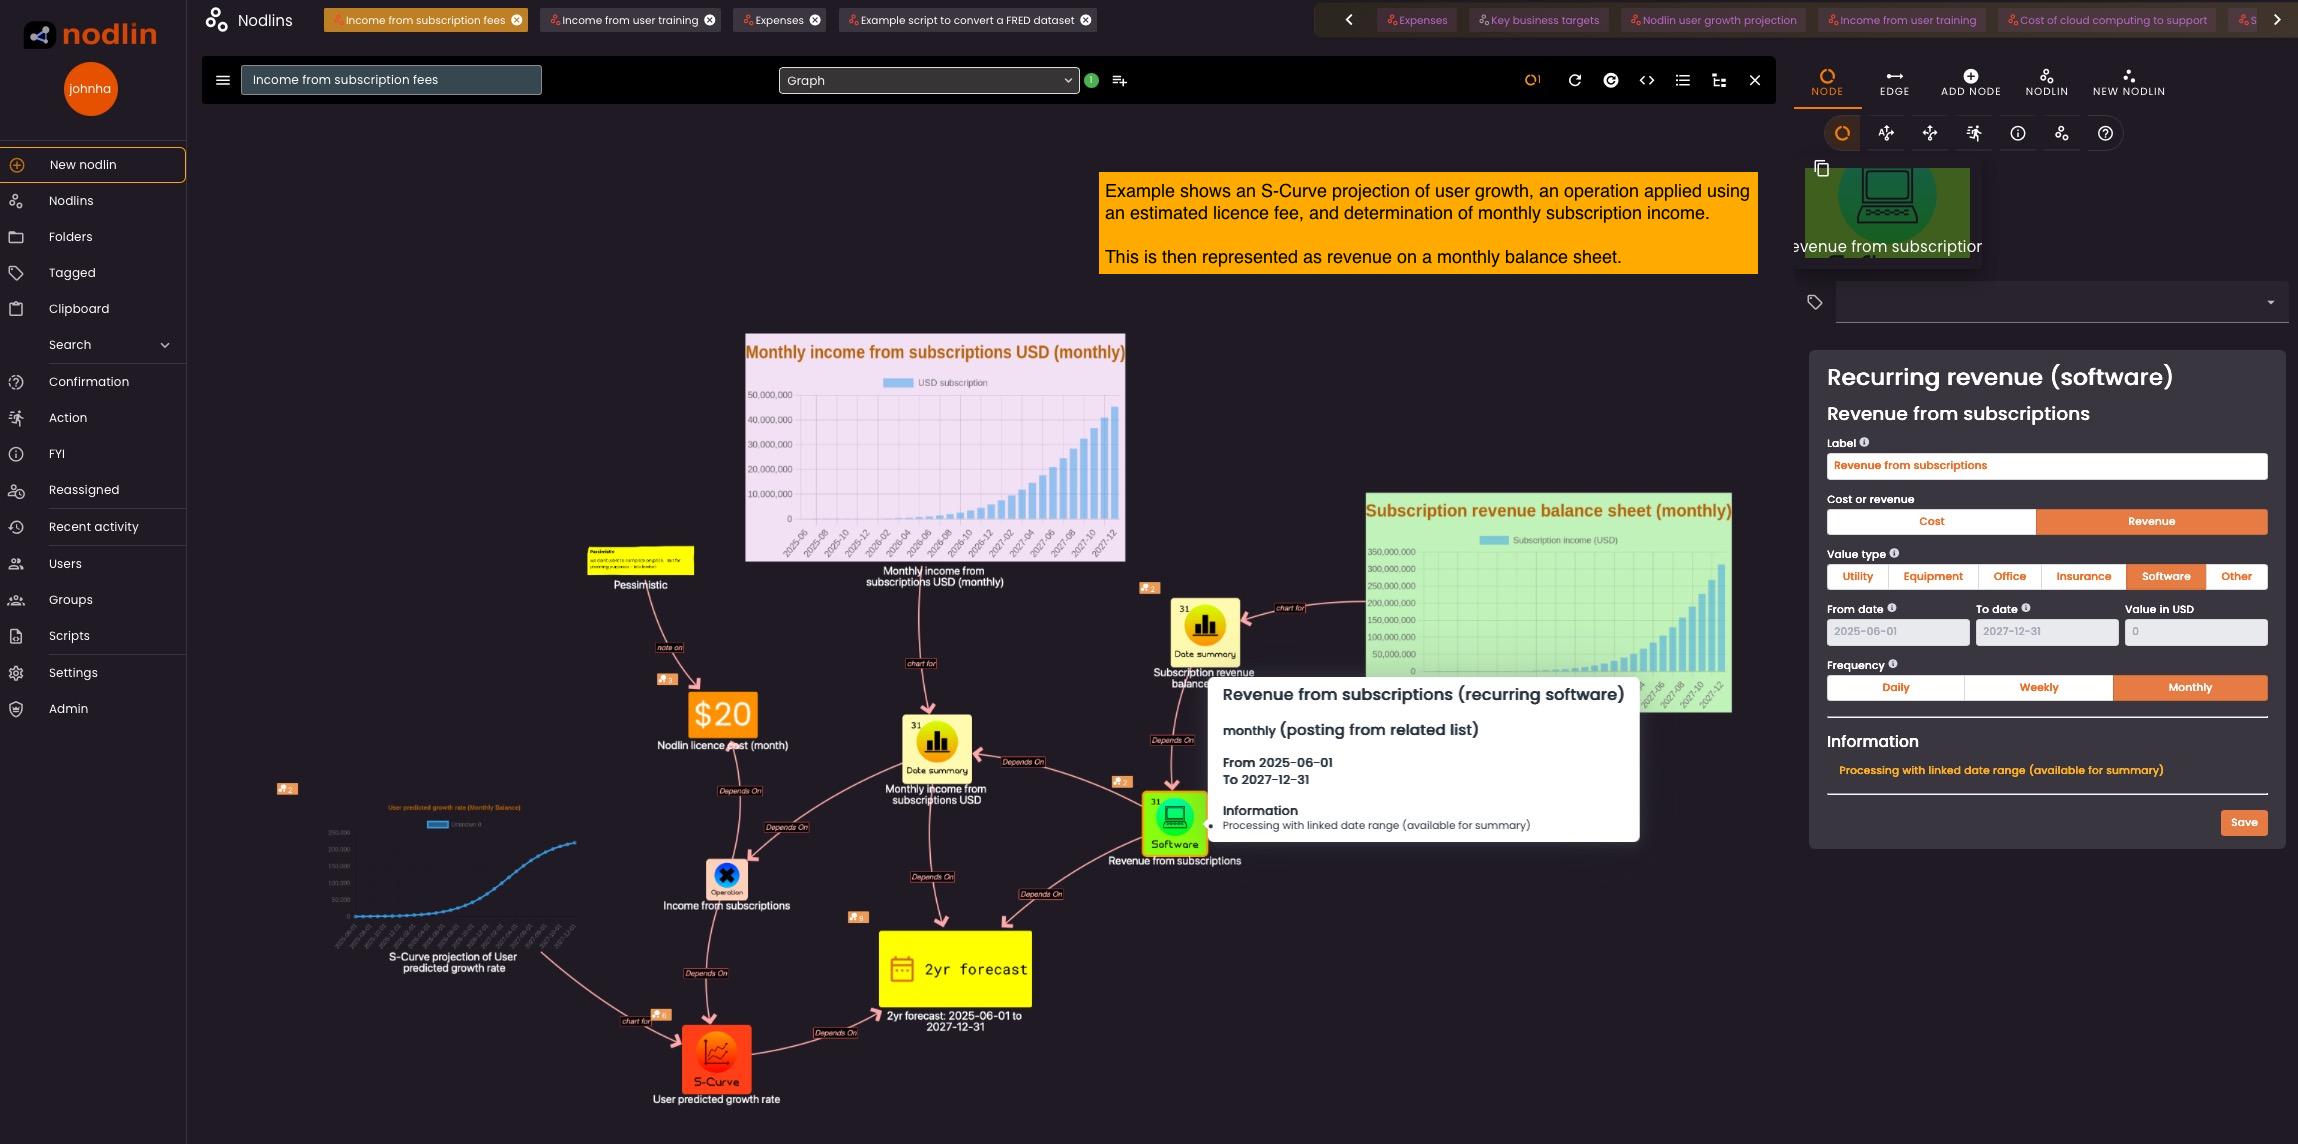
Income from subscriptions
We have taken the expected population growth and assumed licence fee, to determine a monthly revenue from subscriptions.
This is then linked to the balance sheet so show incremental revenue.
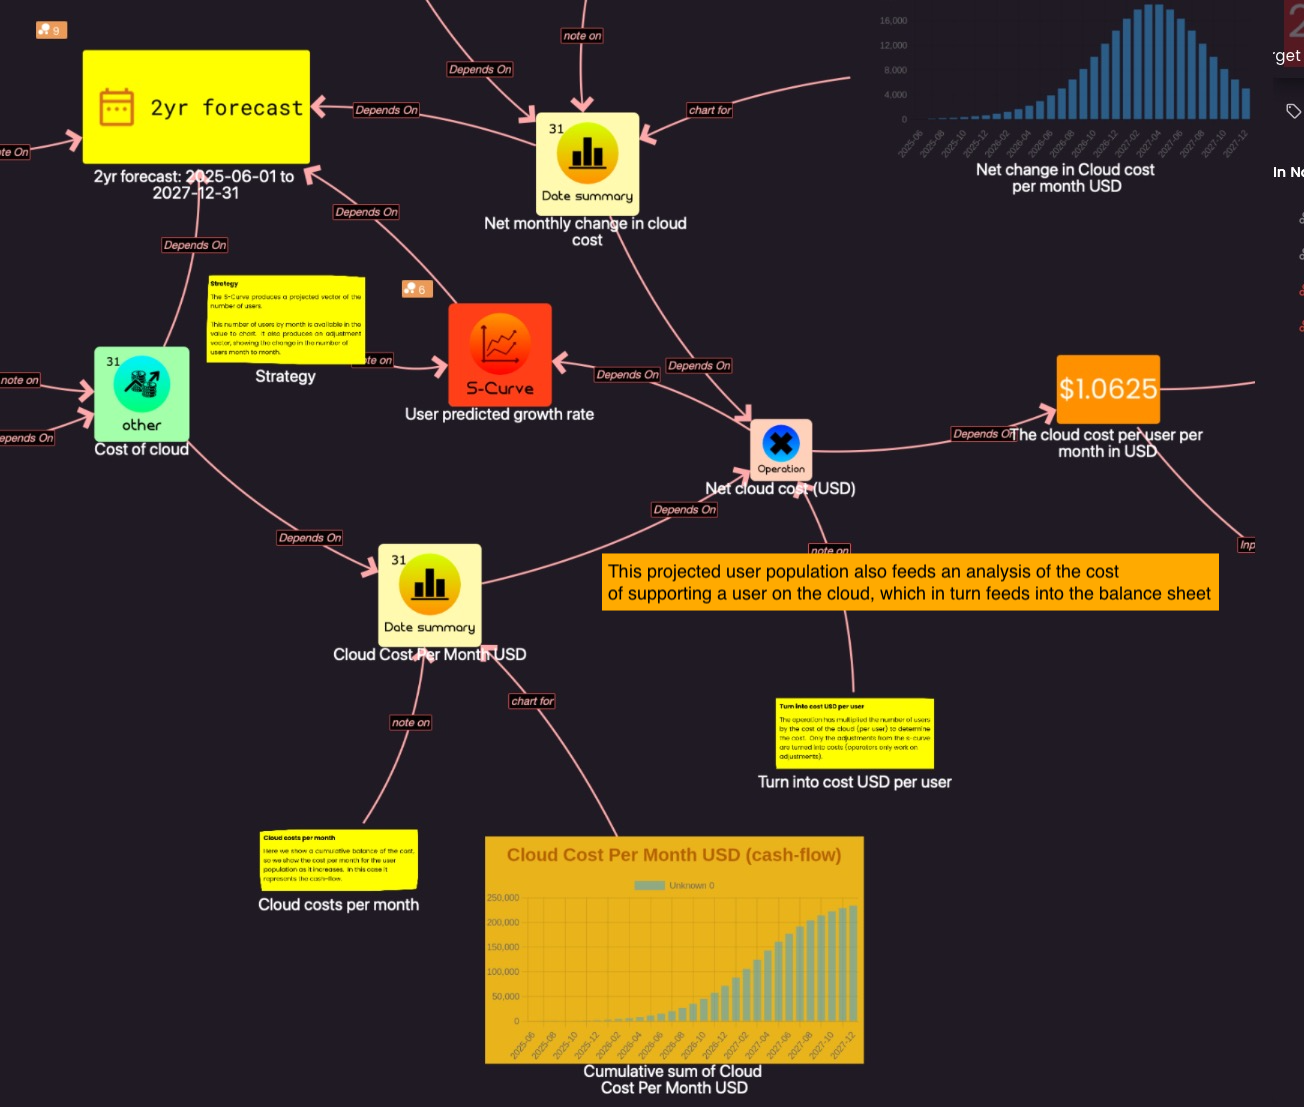
Costs of compute
We have taken the same S-Curve of projected users, together with the expected compute costs, to determine the monthly cost of compute. We have assumed number of users per nodlin cluster, and the cost to support the cluster on the cloud.
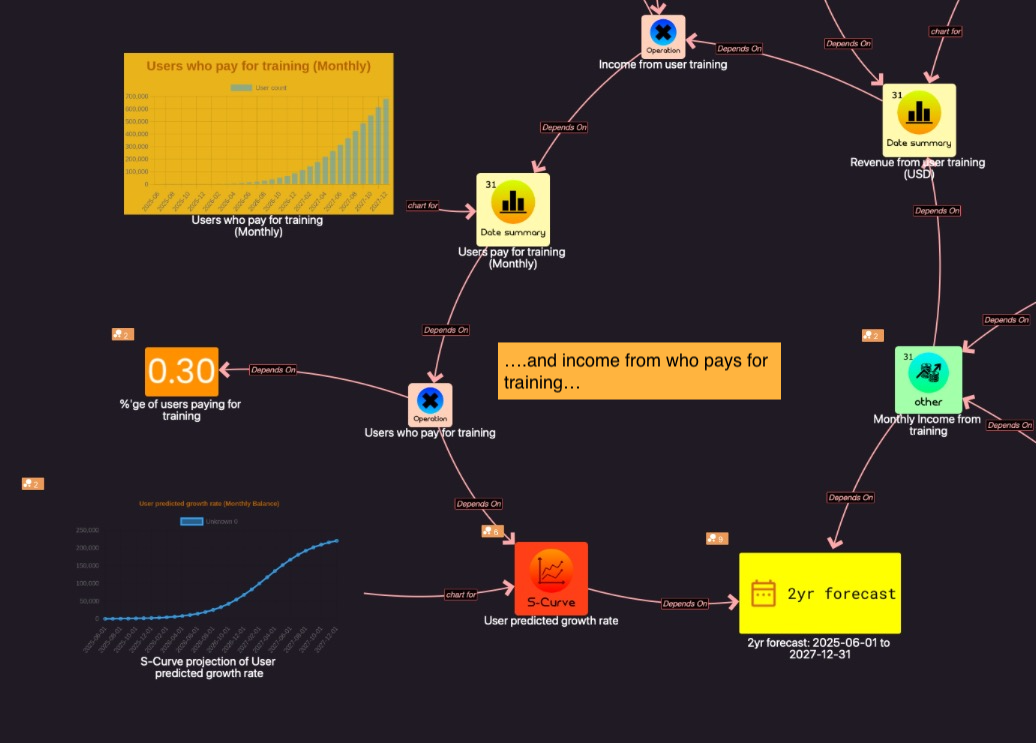
Income from training
Furthering the analysis, we assume that a certain number of users will pay for training. We have assumed this is external training in this case, but a small retainer to be paid for providing authorised training.
This is an additional revenue stream.
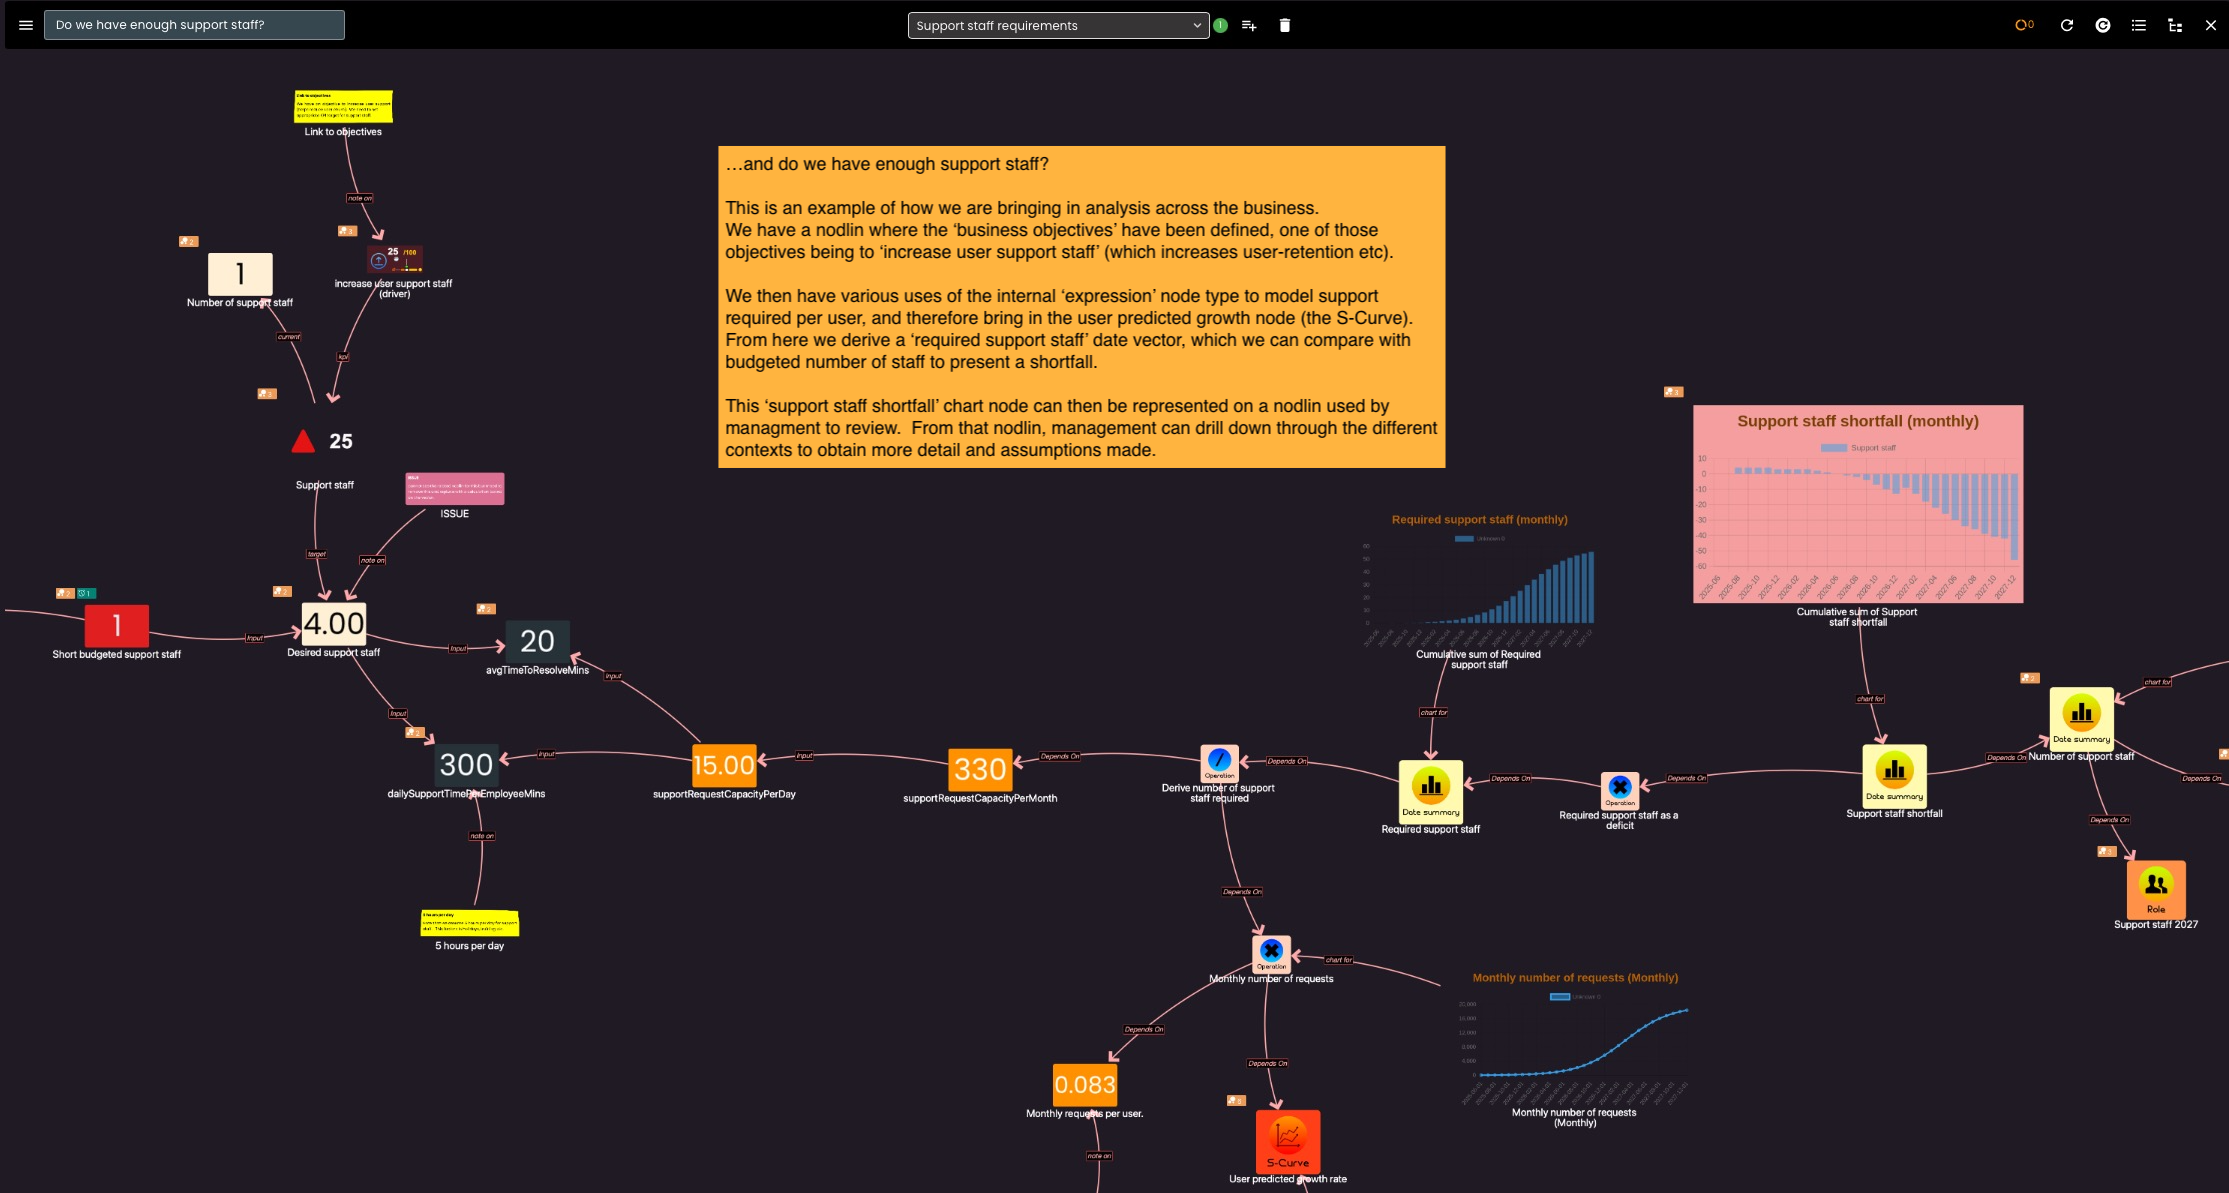
Support staff
The number of support staff required is dependent on the user population. Assumptions will have to be made around how many support tickets will be created by each user and how many tickets can be handled by each staff member. From these assumptions we can calculate the monthly cost of support staff.
Crucial to user growth will be retaining the existing users. In the following example we show the relationship to the objective of providing support when required. This is modelled in the business objective hierarchy to increase the monthly average users. We are monitoring KPIs for this.
A chart is also shown in this example of the support staff shortfall. So we have calculated the number of support staff required and factored in the cost of support staff we have currently accounted for on the budget. We have added another reference to this chart to another nodlin for regular management review.
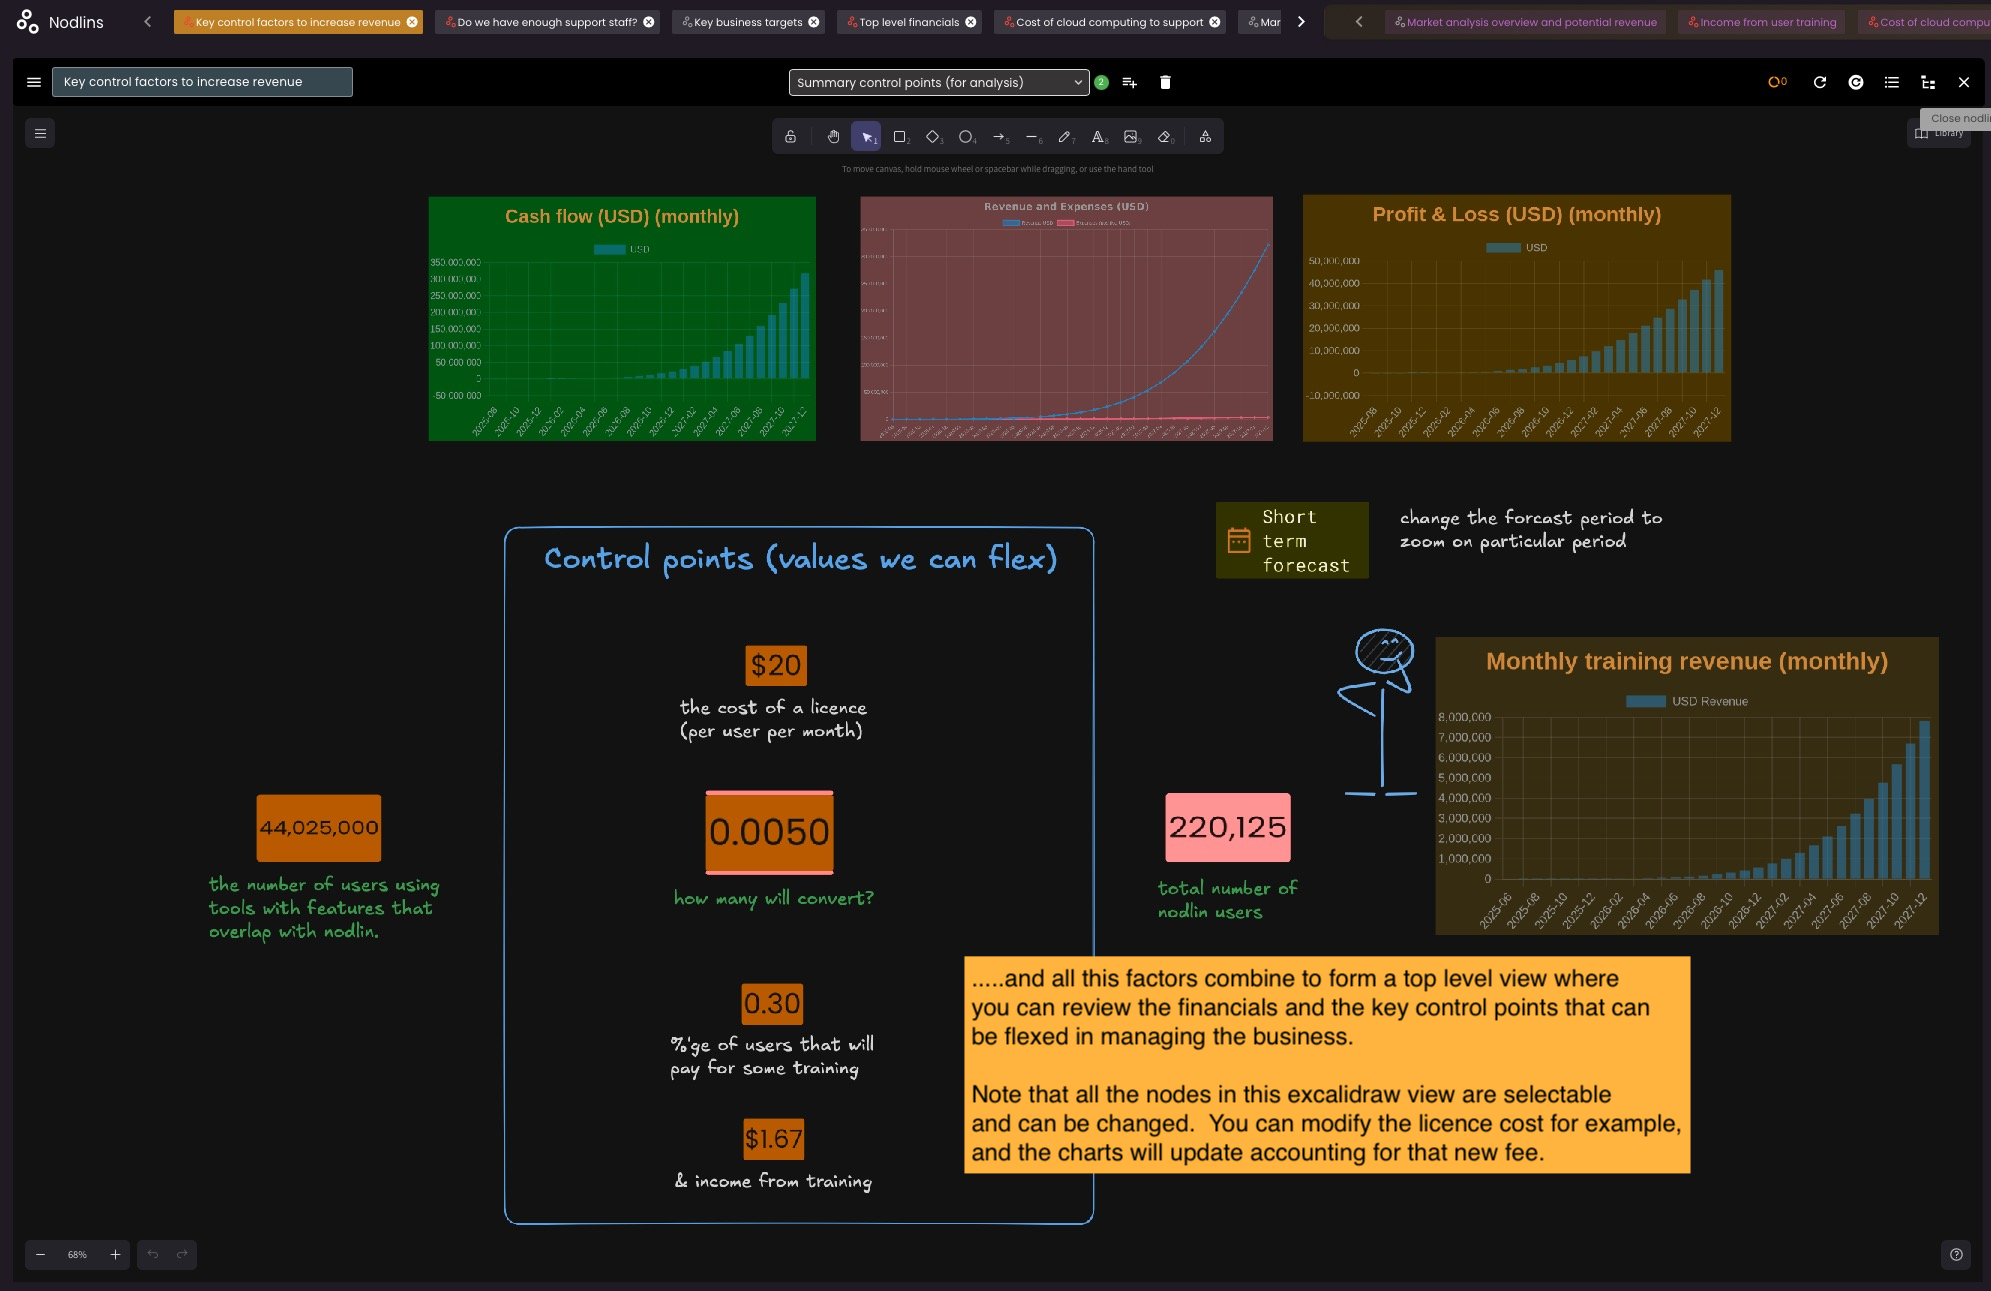
Overall business control point and revenue review
To simplify the analysis, in this example we have produced a high level dashboard view in excalidraw. This shows the factors we can control (cost of a licence, user conversion rate, users requiring training etc) and the resulting cash flow, revenue/expense and P&L.
Note that unlike a dashboard, this information is live. The nodes displayed can be selected and modified. You will then see the changes reflected in the charts.